Difference between revisions of "PRO Tutorial"
(→FTP Upload of CSV Exports) |
(→FTP Upload of CSV Exports) |
||
| Line 41: | Line 41: | ||
# '''Define the CSV schema''': The structure of CSV exports is defined by export templates that are user-defined and can be found in PC network share "templates". Export templates have extension ".exp" while the generated exports are stored in "export" folder and have extension ".txt". We start with pre-defined standard template "standard-iso.exp". This template defines a schema where columns show ''date, time, temperature, humidity, dew point, pressure, wind speed, wind gust, wind direction, rain fall'' holds these data the following. | # '''Define the CSV schema''': The structure of CSV exports is defined by export templates that are user-defined and can be found in PC network share "templates". Export templates have extension ".exp" while the generated exports are stored in "export" folder and have extension ".txt". We start with pre-defined standard template "standard-iso.exp". This template defines a schema where columns show ''date, time, temperature, humidity, dew point, pressure, wind speed, wind gust, wind direction, rain fall'' holds these data the following. | ||
<nowiki>## Standard CSV template with data in metric units | <nowiki>## Standard CSV template with data in metric units | ||
| − | ## | + | ##<BR> |
| − | ## date, time, temperature[C], humidity[%], dew point[C], sealevel pressure[hPa], | + | ## date, time, temperature[C], humidity[%], dew point[C], sealevel pressure[hPa], avg wind speed[m/s], gust speed[m/s], winddir, rainfall[mm]<BR> |
| − | + | [YYYY]-[MM]-[DD],[hh]:[mm],[th0temp-avg.1:],[th0hum-avg.0:],[th0dew-avg.1:],[thb0seapress-avg.1:],[wind0avgwind-avg.1:],[wind0wind-max.1:],[wind0dir-avg.0:],[rain0total-sum.1:]<BR> | |
| − | [YYYY]-[MM]-[DD],[hh]:[mm],[th0temp-avg.1:],[th0hum-avg.0:],[th0dew-avg.1:],[thb0seapress-avg.1:], | + | |
| − | + | ||
</nowiki> | </nowiki> | ||
</translate> | </translate> | ||
Revision as of 20:06, 15 December 2015
<languages /><translate>
This page lines out some Meteobridge PRO specific how-tows
Contents
Optimize RF reception
Meteobridge PRO (red cap model) has a RF receiver included to directly pick-up data from Davis outdoor sensors. Compared to a Davis console where only very little computing stuff is happening, we have a high density of sensors, computing modules, Ethernet circuitry and even a WiFi module all together in a very compact housing.
To keep RF noise away from the reading Davis sensor data, we designed an external antenna. The antenna shipped with Meteobridge PRO is quite good in RF operation and picks up about 5 db more signal strength than the wire antenna of Meteostick does. However, if your sensors are far away some tweaking of RF reception might be necessary.
This section of the tutorial explains what you can do if you need improved RF sensitivity.
Turn the Meteobridge PRO into an RF strength meter and find a good place to rest
Before you start experimenting how to improve RF reach we recommend to run through the following steps:
- Configure your Meteobridge PRO to connect via WiFi with your network. As you might want to move the Meteobridge PRO and test for various locations, having an Ethernet cable hanging around will be annoying.
- Configure your Meteobridge PRO to make use of the internal RF functions and configure "Meteostick:Vantage" option according to your needs. Set correct transmitter ID, set bandwidth to "small" and set sensitivity to "-90db" to start with. Picture on the right gives an example how your settings might look like.
- Power your Meteobridge PRO temporarily with a USB power bank. I assume you have some 5V rechargeable battery with USB plug to feed the Meteobridge PRO laying around. Any cheap power bank for your mobile phone will do. You will need a USB cable that fits into the micro USB power socket of the Meteobridge PRO, but I am sure you have that somewhere in your household. Being on battery and WiFi you have total freedom in checking for a good place for the Meteobridge PRO to rest.
- Define a display service on "Services" tab that shows RF data from the outdoor sensors on the integrated display and updates the display every 5 seconds. To do so, define a new service of type "Display" and select "Periodical" as it's event type. Press "Add Service Event" and a new event will be added to the list of already defined events. Then specify "every 5 seconds" as interval and select "Meteostick RF Analysis" from the list of pre-defined standard messages. Settings for this service should look like shown on the right picture. Don't be confused by the message text that is automatically inserted. If you want to understand how this works, please have a look at page PRO_Display. For the moment you don't need to know the details ;-)
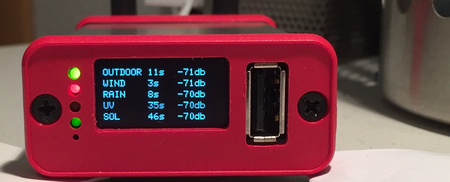
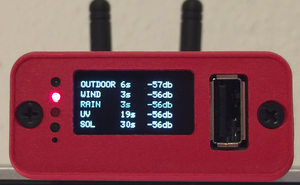
Having done so the Meteobridge PRO display will show data like this:
Picture on the left shows reception when Meteobridge PRO is directly sitting on my desk with a lamp, some metal enclosures and the metal corpus underneath my desk in direct neighborhood. Values around -70db are not great, but still no problem to receive. When it reaches the -90 db reception will get tough. By moving the Meteobridge less than a meter away to a higher position on a shelf, reception situation improves significantly. You see that on the right picture. Signal strength in the mid -50db is much better and will allow the sensors to go further away without having the connection dropped. By the way, the display is white but my camera makes it look blue sometimes.
No one can tell you what best position will be in your location, but you are highly invited to check out yourself.
Change Antenna
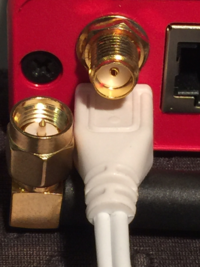
RF antenna on the back panel of the Meteobridge PRO can be unmounted and replaced by a larger and more capable model. Meteobridge PRO offers a standard SMA plug, where any antenna suitable for the RF band your Davis sensors operate in (915 MHz for US, 868 MHz for EU) will fit, as long as it has a male SMA plug. What you can do in principle is going three ways:- replace small antenna by a larger one that better fits to the wave length of your sensors signals.
- connect an antenna that is not directly mounted to the connector but has some cable to bring the antenna further away from the RF noise the Meteobridge PRO is inevitable producing and by that giving the RF signals more head room by reducing the noise floor.
- connect to an antenna with some directional characteristic, which can be a small yagi or other form factors. This might be an option to consider when extreme reach needs to be achieved and if you can mount the antenna outdoors as a directional yagi antenna might not fit well to your indoor living style ;-)
Picture on the right shows how the Meteobridge RF SMA female connector looks like and how the antenna SMA male plug is formed.
Console Retransmits
When nothing else helps, you can always ask your Davis console to retransmit packets and to let Meteobridge PRO sniff data from there. As packet retransmits mostly have a lager frequency drift, you need to change the Meteostick settings on "Weather Station" tab regarding bandwidth from "small" to "normal". Furthermore, you have to select the transmitter ID the Console is using for the retransmits. Having the console just a few meters away from the Meteobridge PRO even the worst antenna will do ;-)
FTP Upload of CSV Exports
There have been may requests to upload data of a day or month in some CSV like notation onto a server via FTP. Meteobridge PRO has the building blocks (export function and FTP upload capability) to make this reality. This section explains how to set this up:
- Define the CSV schema: The structure of CSV exports is defined by export templates that are user-defined and can be found in PC network share "templates". Export templates have extension ".exp" while the generated exports are stored in "export" folder and have extension ".txt". We start with pre-defined standard template "standard-iso.exp". This template defines a schema where columns show date, time, temperature, humidity, dew point, pressure, wind speed, wind gust, wind direction, rain fall holds these data the following.
## Standard CSV template with data in metric units ##<BR> ## date, time, temperature[C], humidity[%], dew point[C], sealevel pressure[hPa], avg wind speed[m/s], gust speed[m/s], winddir, rainfall[mm]<BR> [YYYY]-[MM]-[DD],[hh]:[mm],[th0temp-avg.1:],[th0hum-avg.0:],[th0dew-avg.1:],[thb0seapress-avg.1:],[wind0avgwind-avg.1:],[wind0wind-max.1:],[wind0dir-avg.0:],[rain0total-sum.1:]<BR>
</translate>


